
Google Analytics: The tool every good marketer knows they need, but may not know exactly how to use. I’m here to spare you hours of training courses by getting you started on where you need to look first, the terms you need to know and valuable reports you can access in order to understand how your website and other marketing initiatives are performing.
Key Terms in Google Analytics
After adding the tracking code to your site, the first step in understanding exactly what your Google Analytics account is telling you is learning which metrics you should be monitoring in order to measure performance. There are lots of different metrics, dimensions and terms throughout your account, and they all have their own value, but to start you off, here are some of the most important ones to keep in mind:
- Property: This is a group of information that you can direct Google to pull data from. Properties are determined in the setup process, and most of the time they represent your website(s) or domain. This is not a metric or dimension for measurement; it is simply the first step in how you structure your Google Analytics account.
- Users: A user is defined as an individual person browsing your website. By default, Google counts each user based on their individual browser cookie. Users can visit your site multiple times, each with multiple sessions and pageviews, but will still be counted as one user.
- Session: A session refers to the period of time during which a user is active on your site or app, and consists of a series of pageviews that the user makes during that time. In simpler terms, a session is a site visit.
- Pageview: This metric is much more straightforward than the rest, but equally as important. A pageview is recorded every time a page is viewed, and allows you to see which pages are viewed the most. A single user can generate multiple pageviews, even on the same page if they load it or return to it many times.
- Unique Pageviews: By comparison, a unique pageview is only counted once per session; it is unique to the user. For example, if a visitor views a page twice in a session, it’s only counted as one unique pageview.
- Bounce Rate: This is the percentage of sessions where the visitor only viewed one page on your site and left without taking any further action. It’s best to monitor your bounce rates, especially per page, to make sure your site content is engaging enough for users to remain on the site and click through to other pages or content. We typically see bounce rates in the 45-65% range with most of our B2B clients.
- Time on Page: Another pretty obvious metric, this represents the average time in seconds a person spends on a specific page. This is useful in determining if your page content is beneficial to users, depending on how long they spend viewing it. For some pages, like educational content, you’ll want to see a longer time. But for other content, like your contact page or conversion-focused landing pages, you’ll actually want to see a shorter time spent, which may indicate that people are finding what they need quickly and taking action.
A great resource for all Google Analytics terminology is Loves Data’s full glossary. Keep this handy as a reference!
Getting Started with Analyzing Data
Once you’re comfortable with basic Google Analytics terminology, you’ll be able to start analyzing your data. Let’s review some of the most valuable reports that are readily available for you. Google does a good job at providing several helpful collections of data based on a few different categories, which should be suitable for daily, weekly and monthly reporting. Custom reports won’t need to be created just yet, unless you’re looking for something really specific. Creating custom reports is a topic for a whole other blog post!
When in the desired Google Analytics Property for your website (as described above), you’ll land on the Home page by default. This is a dashboard that can be used to view high-level information for certain important website data sets. Each widget in the dashboard will bring you to the full report when clicked. This is a great place to start familiarizing yourself with performance data and what it all means.

The left-hand navigation pane lists all of the report options, grouped into five categories: Realtime, Audience, Acquisition, Behavior and Conversions. These categories help guide you in determining what information you’d like to view. Each of these reporting tabs, excluding Conversion, has an Overview report. The Overview reports are useful for reviewing data related to that category at a glance, and feature a summary of information from more detailed reports within that section.
Which Google Analytics Reports Should I Use?
Under these five categories, you’ll find many reports that Google automatically provides for you. Sifting through all of these can be overwhelming if you’re not sure what you should be measuring. Here are some reports that we use regularly when reviewing our clients’ web performance:
- Audience Overview Report by Month: This gives you a basic and necessary overview of most of the metrics listed above. The best way to use this report is to select a time period to see website traffic during that time. Use the chart to get a visual representation of how your metrics are trending within that time period. For example, if you choose to measure traffic over the last quarter, you’ll see the changes monthly, weekly or daily depending on which interval you select.

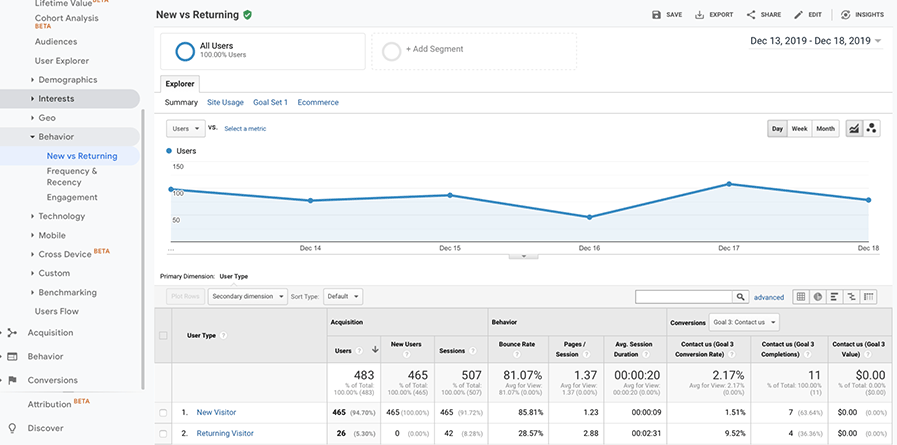
- New vs. Returning Visitors Report: This report shows the proportion of new and returning visitors your site has had during a certain time period. Returning visitors are important because they represent those users who remember your website and find it useful enough to come back. They become followers of your organization and, ultimately (hopefully!), customers. An increase in returning visitors is a great sign that your website provides valuable content or services for those who were once “new” visitors. On the flipside, growth in new visitors shows that you’re reaching new audiences with your marketing efforts, which is also a great sign – assuming that their bounce rate isn’t too high!
- Traffic Acquisition Report: It’s important to know where your website visitors are coming from. Do you get most of your traffic from organic search? Have you seen an increase in social traffic recently? Monitoring activity on this report will help you start making some connections as to how other marketing efforts affect your website traffic. For example, maybe you started some PPC campaigns in the last few months. You can use this report to see what percentage of your website traffic increase can be attributed to that new PPC initiative. It also helps in comparing a certain time period to the same period last year to see how your traffic has changed over time.

- Landing Pages Report: People enter your website through all different channels, landing on all sorts of pages. This report shows you these pages. Knowing where your web visitors first land when they enter your site is valuable. Based on this information, you can start to draw conclusions on how users are interacting with your site. A good metric to monitor here is bounce rate. If you notice that one of your site’s landing pages has a higher bounce rate than the rest, you’ll need to make that page more engaging to encourage visitors to stick around.

These are just a few reports to get you started in determining how users navigate your website. The best advice we give to Google Analytics newbies is to spend some time in the tool, exploring all the different reports and data. The more comfortable you become with the information, the more you’ll be able to start using that data to inform your marketing decisions. Google Analytics is on your side, you just have to start utilizing it!
Still feeling unsure of where to start? Let us help you analyze your web performance. Contact me today to get started.

Amy Schneider
Vice President, Creative Services